


Executive Summary
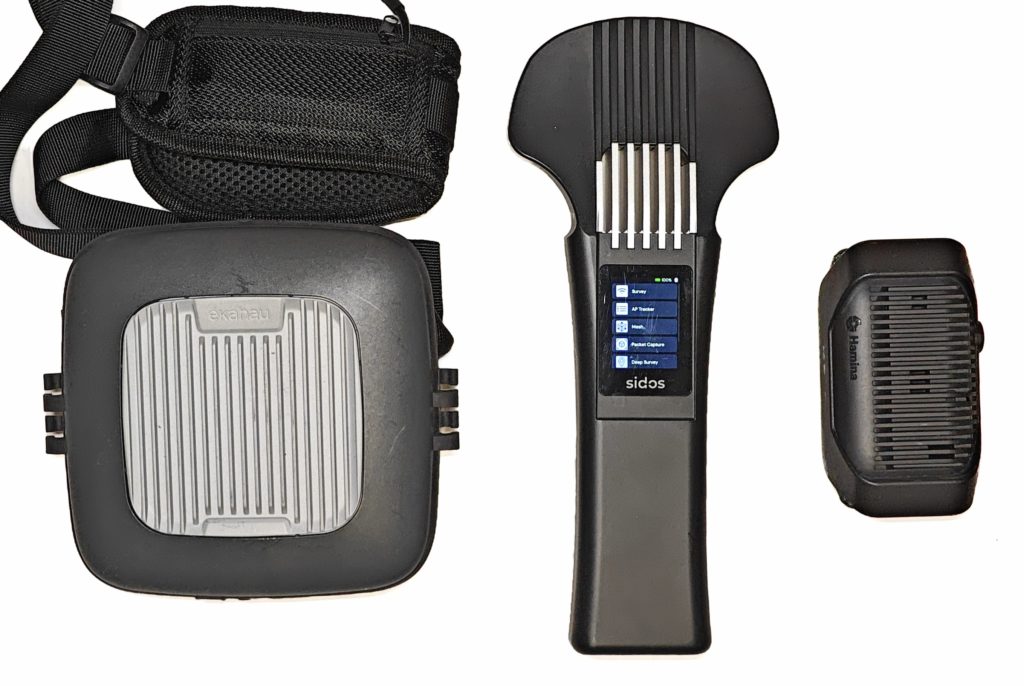
Wi-Fi surveys don’t have to be bulky and complicated. Clip is a lightweight, wireless measurement device that, together with a smartphone app, becomes an agile survey tool. With only two radio modules instead of four – and therefore significantly cheaper compared to previously available professional alternatives. What initially sounds like a disadvantage turns out to be almost irrelevant in practice. Here, the Oscium Nomad, the SIDOS Wave or the Sidekick series from Ekahau should be mentioned, which are in a different price segment and thus also a different performance range. – Clip is aimed at technicians, IT admins and network professionals who need to work quickly, discreetly and reliably. Real-world practice over the last few days with the CLIP clearly shows that the main advantage lies in the size and invisibility during measurement. This massively accelerates and simplifies the actual measurement workflow on-site.
Clip works wirelessly & seamlessly with Hamina Wireless (Planner & Onsite) and enables:
– AP-on-a-Stick Surveys (validate planning before installation)
– Post-Installation Validation (does the coverage really fit?)
– Live Troubleshooting (respond quickly to complaints)
– Systematic Lag Trap Identification
(Co-Channel Interference, Roaming Gaps, TX-Power Errors, Jitter)
Unlike fully automated remote solutions like SIDOS Deep Survey, the survey process with Clip remains somewhat more labor-intensive and requires two devices – but offers maximum control in the field with cost-effective flexibility.
The Problem: Bulky Survey Devices vs. Practical Field Reality
Classic Wi-Fi site surveys demand compromises:
Scenario 1: Large Survey Equipment
– iPad/Laptop, external measurement card/Sidekick, cables, power supply
– Conspicuous, bulky, impractical in buildings
– Setup takes 10+ minutes until the first measurement runs
– Cost: €3,000 – €8,000 for hardware alone
Scenario 2: Remote Assessments (e.g. SIDOS Deep Survey)
– Save costs (under €200 per survey)
– But: No on-site control, no live adjustments
– Ideal for overview assessments, not for detailed troubleshooting
Scenario 3: Smartphone App Alone
– Practical in the field
– But: Too weak for professional measurements
– No reliable capture of all APs, frequency bands and metrics
Clip addresses exactly this gap.
It combines the flexibility and lightness of a smartphone setup with the measurement accuracy of professional devices – at a fraction of the cost.
What is Hamina CLIP?
Core Concept: The Intelligent Measurement Duo
Clip consists of two components that together form a professional survey system:
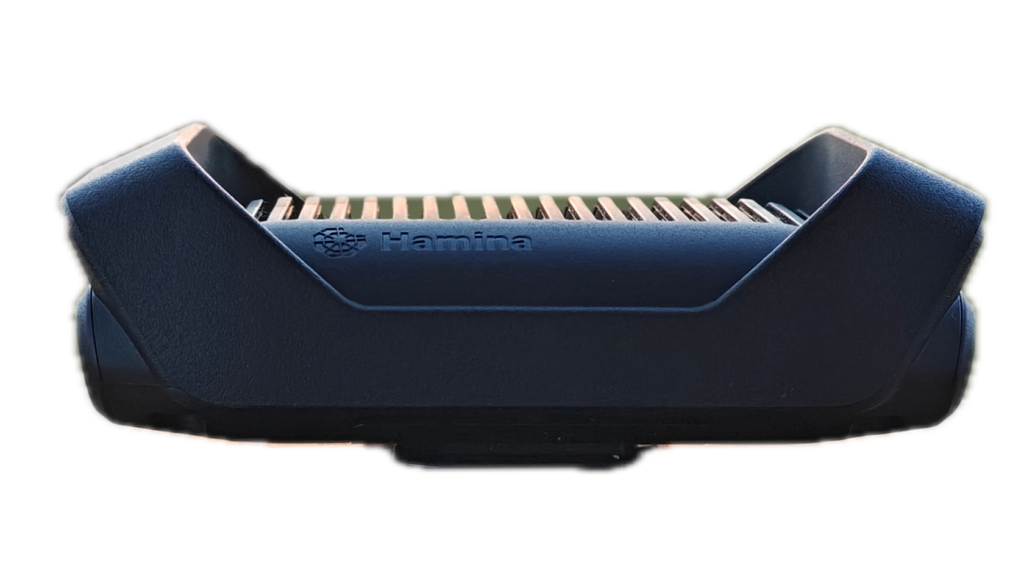
1. Clip Device (Hardware)
– A small, lightweight, portable Wi-Fi measurement device with 2 radio modules
(instead of 4 like the Nomad from Oscium)
- Lightweight, discreet, wireless
- easily attachable anywhere with belt clip
- Directly connected to iPhone/iPad/MacBook via BLE or USB-C
- Measures Wi-Fi signals, interference, SNR on all bands (2.4, 5, 6 GHz)
- Supports Wi-Fi 6, Wi-Fi 7 and is Wi-Fi-8-ready
- Supports PacketCapture
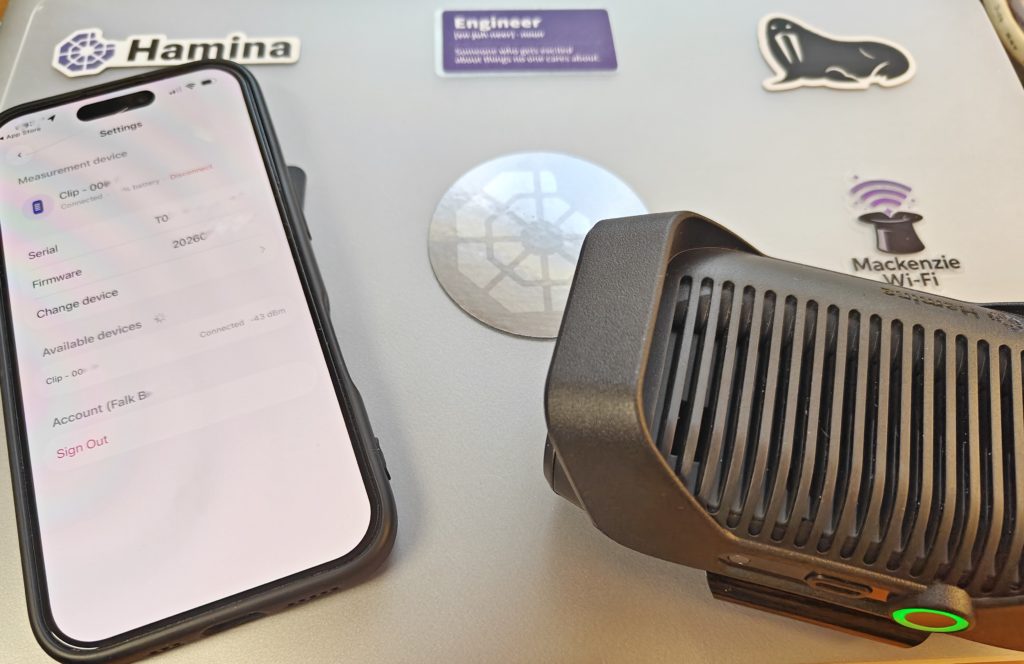
2. Hamina Onsite App (Smartphone/iPad/MacBook)
– iOS app for iPhone/iPad/MacBook
– Connects to Clip via BLE or USB-C
– Shows live heatmaps, coverage images, interference maps
– Integrates directly with Hamina Network Planner cloud projects
– Works truly wirelessly – data synchronizes via BLE to smartphone and to the cloud
The principle: Clip is the measurement head, your smartphone is the intelligence. Together a team.
Here’s much more to expect in the near future, something was already shown at the launch event watch here.
How Clip Works in the Field
Step-by-Step in Daily Use
Setup (5 Minutes)
1. Open Hamina Onsite App
2. Load existing Hamina project (from cloud or offline copy)
3. Connect Clip to iPhone/iPad via USB-C only necessary the first time
4. BLE pairing is set up
5. Unplug USB-C cable again
6. App confirms connection → “Survey ready”
No laptop. No cable mess. No login chaos.
Conduct Survey (15–60 minutes depending on size)
Three measurement modes (like with the Oscium Nomad):
Point Measurement (Point Survey)
– Stand still at critical locations (meeting room, cafeteria, dead zone)
– Tap app button → measurement starts for 5–10 seconds
– All APs, SNR, interference are captured
– Point is marked on the building plan
– Live heatmap shows how coverage is composed
Line Measurement (Line Survey)
– Walk the path, iPhone in hand
– App records continuously
– A data point every 1–2 meters
– Ideal for corridors, stairs, warehouses with long shelves
How does a line measurement work?
When you tap on the map and begin walking in a straight line, the measurement device (Clip/Nomad) scans all active channels and streams the data in real-time to the Hamina Onsite App. The app stores the measurement points in a temporary buffer.
As soon as you tap on the map again at the end of the line, Hamina Onsite distributes the collected measurement points evenly along the line. That’s why a consistent walking pace is so important!
Continuous Measurement (Continuous Survey)
– Clip runs continuously, app in background
– Perfect for “walk-through troubleshooting”
– Every position is linked live with data
A continuous measurement is basically a chain of line measurements. The advantage: You can measure very quickly and create a very data-rich recording! The disadvantage: It requires practice, coordination and quick orientation to perform it well.
How to perform a continuous measurement:
Find starting point: Look for a location on the map where you want to start the measurement. Note: As with point measurement, you may need to use reference points (windows, doors, room centers) to determine your exact position.
Tap on the map and immediately start walking in a straight line at a consistent pace. Tap the map again at every stop, start, or direction change. Always walk consistently between taps. If errors occur (e.g., wrong tap), press the “Undo” button to undo the last tap.
Press the “Stop” button when you’re done.
Tip for crowded rooms: A helper who walks ahead, clears paths, answers questions from passersby, and opens doors. This makes survey life significantly easier.
How does a continuous measurement work technically?
When you tap on the map and begin walking in a straight line, the measurement device (Clip/Nomad) scans all active channels and streams the data to the Hamina Onsite App, which stores it in a temporary buffer. When you stop, start, or change direction and tap the map again, Hamina Onsite distributes the measurement points evenly along the last section. That’s why consistent walking pace is so crucial!
“Ok, I understand now. I walk somewhere, stop, tap on the map, and then continue?”
No! Tap when you start, stop, or change direction. That means: When changing direction, continue walking and tap on the map when you change direction. If you do it right, your gait looks somewhat robotic – which could be useful for the robot wars of the 90s. 🤖
“Got it. But I always have to walk consistently, right?”
Between taps, yes. You can change pace at each tap. The key: consistency between taps. Tap on the map and walk slower to gain time to plan your next section. 🧠
Navigating Obstacles
When you need to pause at an obstacle (e.g., door), here’s how:
Walk to the door and tap on the map just before stopping.
While you’re standing (getting keys out, opening door, etc.), Hamina continues collecting measurement points. Door open, ready to walk through? Tap the same point on the map and continue walking.
Why this is genius: While you’re standing in front of the door, Hamina collects many measurement points that are then averaged. The measurement at this location (or where you talked to someone) becomes extremely precise! Works for any obstacle – even if you just want to pause briefly or reorient yourself.
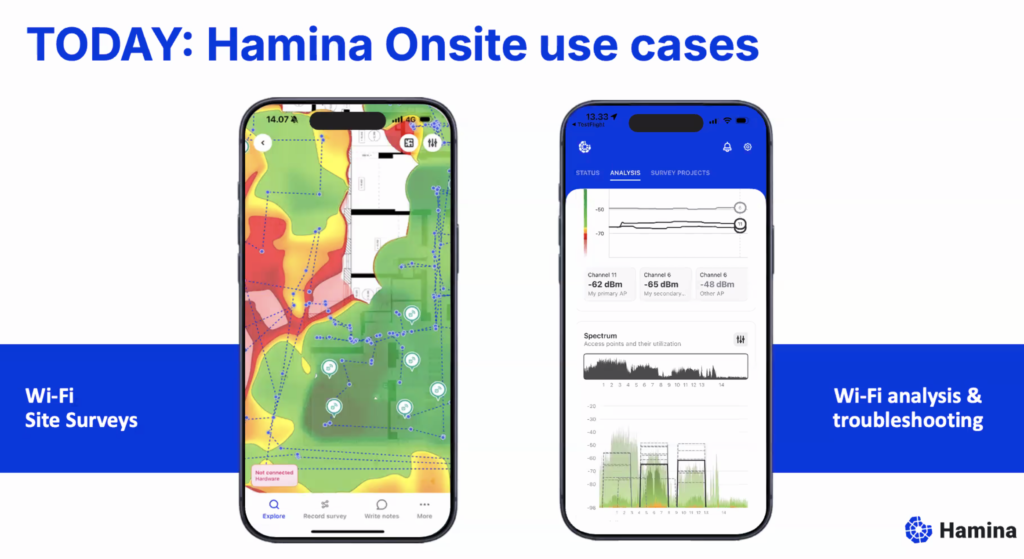
Live Heatmaps in the Field
While you survey, your smartphone already shows the results:
– Coverage Heatmap: Where is the signal good, where weak?
– Interference Maps: Too much overlap? Neighboring APs in the way?
– SNR Map: Signal-to-Noise Ratio per zone
– AP Detection: All detected APs with channel, power, clients
→ You recognize problems immediately and can correct them, not days later during evaluation.

Field Documentation with Hamina CLIP
The Onsite App allows:
- Notes/comments directly on the map (“There’s a metal roof here – signal drops”)
- Photos of critical spots (misplaced AP, dead zone), directly with location in building plan and cloud synchronization
- Marking of problems
This saves you from guessing later: “Why was this spot bad again?”
Synchronization to the Cloud
Back in the office:
1. The measurement data is directly available in Hamina Survey
2. Deeper analysis available in the web UI
3. Comparisons with previous surveys, trend analyses
4. Share or export for reports, PDF, documentation of changes
Clip in the Hamina Wireless Ecosystem
Three Phases of Network Life
Phase 1: AP-on-a-Stick Surveys (Design Validation)
Problem: You’ve planned a network in Hamina Planner. But does it really fit?
Solution with Clip:
– Mount AP physically on a tripod (e.g., with a Wi-Fi Stand from the kit: https://wlan-manufaktur.com/products/apos-site-survey-set)
– Walk around with Clip and smartphone
– Real-time heatmap shows actual coverage
– Compare with planning: “Does it fit or do we need to move the AP?”
– Be sure before final installation
Time saved: Instead of “build first, regret later” – now “validate beforehand”. Cost savings from one misplaced AP: €500 – €2,000.
Phase 2: Post-Installation Validation
Problem: APs are installed. Does the network meet requirements?
Solution with Clip:
– Turn on all APs/radios, start Clip survey
– Live heatmap shows: Are there dead zones? Too much overlap? Poor roaming paths?
– Correct immediately (power, channel, antenna orientation) and revalidate
– Generate precise documentation for clients/audits
Time to handover: 2 hours instead of 2 days (because no post-processing delay due to long PDF reports).
Phase 3: Live Troubleshooting & Monitoring
Problem: User complains: “Wi-Fi is always bad here.”
Solution with Clip:
1. Quickly go to the problematic location with Clip & smartphone
2. Start Onsite App → analyze live data
3. Interference? Co-channel APs? Signal too weak?
4. Cause identified in minutes instead of guessing
5. Perform on-site correction and validate area
Example: “The conference room had too much interference from APs in the U-NII-1 band. Channel switch to DFS channel, re-measured, problem solved.”
Clip vs. Oscium Nomad: The Hardware Perspective
Here’s the honest comparison table:
| Clip | Oscium Nomad | Winner | |
| Price | 990 $/€ incl. Cloud 6 months | $ 1710 without Cloud license | Clip ✓ |
| Radio Modules | 2 | 4 | Nomad ✓ |
| Antennas | 4 | 8 | Nomad ✓ |
| Size/Weight | very small (iPhone size), 282 g | Compact, 2 x Clip, 415 g | Clip ✓ |
| Battery Life | 6 h | 4 h | Clip ✓ |
| Charge and Measure | YES | YES | tie |
| Wi-Fi 7 / 8 Ready | YES | YES | tie |
| Spectrum Analysis | Basic (Wi-Fi chip based) | Optional (ext. device) | Nomad ✓ |
| Target Audience | Daily surveys, AP stick, troubleshooting | Enterprise deployments, complex RF | Clip for 80% of use cases ✓ |
Interpretation
Clip wins at:
– Cost (important for SMB, integrators, freelancers)
– Discretion in the field (no “Why-are-you-holding-that-thing? What’s that on the belt and why does it have a cable to the iPhone/iPad?” looks)
– Battery life nearly endless
(longer surveys without breaks, wireless measurement & USB-C charging simultaneously)
– Everyday usability (smartphone app without cable feels significantly more natural)
Nomad wins at:
– Parallel scanning
(4 radios can monitor different channels simultaneously)
– Full spectrum analysis
(important when non-Wi-Fi interference could be a problem)
– Enterprise requirements
(very large-scale surveys, extreme environments – translated, what’s worse than trains, train stations, airports or warehouses? Yes, that works wonderfully with the CLIP – If you don’t believe it, just get in touch.)
Rule of thumb: If you do 2+ surveys per month and cost is important → Clip.
If you analyze highly complex RF environments and need spectrum details → Nomad + Spectrum Adapter
Clip Addresses the Same Lag Traps as Deep Survey

If the topic of Deep Survey means nothing to you, then click here.
Although the process with Clip is somewhat different (two devices, manual points), you systematically identify the same problems:
Lag Trap #1: Co-Channel Interference (CCI)
The problem: Your access point and a neighboring AP use the same/adjacent overlapping Wi-Fi channel. They interfere with each other. End devices and APs compete for the available bandwidth in the air.
How Clip finds it:
– Interference maps in Hamina Onsite immediately show multiple APs on the same channel
– SNR (Signal-to-Noise Ratio) breaks down where coverage overlaps
– You see: “Here are 4 APs on channel 48 (5 GHz) active simultaneously”
Solution: Optimize channel planning (validated in Hamina Planner with Clip data).
Lag Trap #2: Roaming Gaps & Poor Transitions
The problem: Device switches between APs but loses packets in the process or – worse – jumps wildly back and forth (roaming jitter).
How Clip finds it:
– You walk the roaming path with smartphone + Clip (e.g., corridor between two APs)
– Continuous measurement shows the handover point
– Signal too weak before switching? → Adjust AP placement
– Overlap too large? → Reduce TX power
– Clients switched backward? → Channel or band problematic
Real-world example: “The conference room had a roaming dead spot between AP_Main and AP_Backup. Measured with Clip, adjusted TX power on AP_Main, dead spot gone.”
Lag Trap #3: TX-Power Errors
The problem: AP broadcasts too strongly (large overlap, other channels interfere) or too weakly (dead zones).
How Clip finds it:
– Coverage heatmap directly shows where signal is too weak
– Interference maps show areas with too many overlapping APs
– You go to the problematic AP and note the current power (e.g., “AP_L2_34: 20 dBm”)
– Clip measurement before and after TX power change immediately shows the impact
Live correction:
1. Lower TX power from 20 dBm to 17 dBm
2. Revalidate with Clip
3. Heatmap updates in real-time
4. Better or worse? See immediately.
Lag Trap #4: Jitter & Performance Drops
The problem: Connection is stable but jittery – fast packets get lost, gamers experience lag.
How Clip finds it:
– Hamina Onsite directly shows SNR and signal stability
– Areas with weak/fluctuating signal = jitter sources
– Combined with Hamina Planner capacity analysis/live view shows: Is it a signal problem or overload?
– Integrated with the Orb app (if available) for active responsiveness tests
Lag Trap #5: Capacity Bottlenecks
The problem: Signal is good, but too many clients on one AP/channel
->data throughput collapses.
How Clip finds it:
– Analysis in the Onsite APP shows number of connected clients per channel
– Heatmap overlay combined with client count: “This zone has good signal but 80 clients on 1 AP – overload!”
– Solution: Plan and install second AP/radio in this area or optimize band steering in Hamina Planner with live view
Hamina CLIP Compared to Other Solutions
Your role determines the tool:
– Integrator/Freelancer with 3+ projects/month? → Clip (ROI quickly achieved)
– IT admin who only surveys occasionally? → Deep Survey or hire Wi-Fi Pro with Clip/Nomad (outsource, low-cost, case-by-case)
– Enterprise Wi-Fi team with real complexity? → Hamina Wireless with Clip & Nomad
(Industry standard, affordable, easy to use and current – Cloud approval? ISO 27001/SOC 2)
Alternative: Ekahau Connect with Sidekick 2 – proven, well-known, elaborate, Cloud approval?
– Auditor? → Nomad & Spectrum Analyzer like the Oscium Lucid (https://oscium.com/products/wi-spy-lucid/) or the NXT-2000 from NetAlly (https://www.netally.com/products/nxt-2000/)
Alternative 1: SIDOS – agile, new, rental model
Alternative 2: Ekahau Connect with Sidekick 2 – proven, well-known, expensive
Clip in Practice: 3 Application Examples
Example 1: AP-on-a-Stick in New Office (30 min, 1,200 m²)
Situation: New office buildout, 5 APs planned in Hamina Planner. But: “Does this really fit?”
Process:
1. Take Clip + iPhone, load building plan from Hamina
2. Mount AP at position #1 on tripod (approx. 3 min)
3. Walk around with Clip, set ~20 measurement points (approx. 15 min)
4. Heatmap shows: AP #1 alone is not enough for the southern wing
5. AP at position #2 on tripod, same spot, re-measure (approx. 10 min)
6. Now perfect – go for installation
Result: Instead of “build wrong, then regret” you know beforehand that the planning works. Cost savings from errors: €1,000 + X
Example 2: Post-Installation Validation (2 hours, Retail Store)
Situation: New Wi-Fi network live, users report: “Wi-Fi is weak up here (2nd floor).”
Process with Clip:
1. Go to 2nd floor, start Clip
2. Continuous survey in warehouse area → heatmap shows: “Dead zone under metal stairs”
3. Next AP was planned too far away
4. With Clip data back to office, in Hamina Planner: “If I move AP_2 30cm closer to the corner, the zone is covered”
5. Technician goes up, moves AP 30cm, Clip validation shows: Problem solved ✓
Total time: 2 hours (1h measurement, 1h adjustment + validation)
Without Clip: 3–4 days planning, discussions, multiple try & error cycles.
Example 3: Troubleshooting – “Wi-Fi drops during meetings”
(45 min, Consulting Firm)
Situation: Conference room on 4th floor has had Wi-Fi problems for 2 weeks. Many helpdesk calls, satisfaction declining, online meetings are unclear, audio choppy.
Process with Clip:
1. User reports: “Around 2:00 PM it gets bad”
2. With Clip + iPhone to conference room
3. Start survey, collect 10 min of data
4. Live heatmap shows: Interference in U-NII-2A band
(Neighboring building is very close and uses channel 58)
5. Hamina simultaneously shows: 3 APs competing here for channel 52
6. Solution: Switch channel to a different DFS channel, Clip validation
7. Problem gone
Root cause analysis: With Clip you can clarify this in 45 minutes. Without Clip it would be speculation, guessing, maybe a week of suffering.
Clip + Hamina: The Process in Detail

Workflow for typical Wi-Fi project including AP-on-a-Stick
1. PLANNING PHASE (in office, in Hamina Planner)
– Create RF planning
– Simulate AP positions
– Predict expected coverage
↓
2. FIELD PREPARATION
– Charge Clip + iPhone
– Synchronize building plan to iPhone (offline possible)
– Prepare AP + tripod
↓
3. SITE SURVEY (on-site)
– Mount AP on tripod at planned position
– Start Clip + Hamina Onsite
– Collect 20–40 measurement points (Point or Line mode)
– Compare live heatmap with planning
– If necessary, move AP and re-measure
↓
4. VALIDATION & DOCUMENTATION
– Take screenshots, photos of problems
– Notes directly in building plan with Onsite app (“Metal wall here breaks signal by 10 dB”)
↓
5. CLOUD SYNC & ANALYSIS (back in office)
– Synchronize data to Hamina Cloud
– Deeper analysis with Planner web UI
– Generate report
– Customer handoff
↓
6. INSTALLATION & HANDOVER
– Physically install AP (confirmed with data from Clip measurement)
– Optional but RECOMMENDED: Post-installation validation with Clip
Cost & ROI: When Does Clip Pay Off?
Investment
– Clip device: 990 $/€ incl. 6 months Onsite license
(significantly cheaper than Nomad)
– Hamina Onsite Subscription: ~ €56 / month
– iPhone/iPad: (probably already available)
Total Entry: < €1000
Scenarios: Break-Even
Scenario A: Integrator with 10 Projects/Year
– Old method: €2,000 × 10 = €20,000 /year
– With Clip: €[Clip] + €780 = < €1000
– Time & cost savings: around €19,000 in the first year
– Break-even: Project 1–2
Scenario B: IT Admin with 2–3 Surveys/Year
– Probably not ROI-positive (Deep Survey is cheaper)
– But: If surveys & troubleshooting occur frequently, Clip pays off quickly
Scenario C: Enterprise Wi-Fi Team with 20+ Locations
– Clip + Hamina pay for themselves after the first month
– Continuous validation becomes practical and economical
Frequently Asked Questions about Clip
Q: How does Clip differ from a free Wi-Fi analyzer app?
A: Free apps are software-based (receiver only). Clip is hardware with a professional measurement card and ensures you have reliable, calibrated readings – not just raw data from the iPhone chip.
Q: Can I use Clip without Hamina?
A: Theoretically yes (via WiFi Explorer Pi – https://www.intuitibits.com/products/wifiexplorerpi/). But the combination is optimized. Without Hamina Onsite you lose the validation features. With Hamina Planner it becomes a complete solution for the entire process.
Q: Do I need Wi-Fi expertise to use Clip?
A: No. The Hamina Onsite app is very beginner-friendly. But: Understanding what the heatmaps mean (SNR, interference, coverage) is important. Clip is a tool, not magic. We offer training for this: Hamina Survey Specialist (https://www.hamina.com/training)
Q: How accurate are Clip’s measurements vs. Nomad?
A: Nomad has 4 radios and can scan in parallel. Clip with 2 radios must measure sequentially, therefore needs a bit longer. For 95% of use cases, Clip is sufficient. Since Clip uses very new intelligent scanning methods, the difference is hardly noticeable in many cases. Already tested and proven live in various scenarios multiple times.
Q: Can I also use Clip outdoors?
A: Yes. Hamina Onsite also supports outdoor surveys. Clip works anywhere as long as the iPhone has a connection.
Q: What is Clip’s battery life?
A: [typically 3–6 hours continuous operation, vs. 4h for Nomad]
Q: Do I need the building as a 3D model in Hamina?
A: No. 2D floor plan is completely sufficient. 3D is an optional feature for complex environments.
The Bigger Picture: Clip as a Tool for Wi-Fi Professionals 2026

Wi-Fi surveys are no longer “big event, once a year, expensive”. They are a continuous optimization tool.
With Clip this becomes possible:
– Quick validation before installation commitment
– Agile adjustment during ongoing operations
– Preventive troubleshooting instead of reactive “problem-solving”
– Cost-effective scaling – more locations, similar costs
Clip is aimed at technicians who know: Good Wi-Fi planning is not one-time – it’s a process.
Summary: Clip – The Professional Measurement Device for Your Pocket
Clip is not for everyone – but for almost everyone.
If your answer to the following questions is yes:
– ✓ Do you do 3+ Wi-Fi surveys per quarter?
– ✓ Do you need quick, on-site validation instead of remote reports?
– ✓ Does your team already work with Hamina Planner?
– ✓ Is cost efficiency important (small-to-medium business)?
– ✓ Do you want live troubleshooting, not just planning?
Then Clip is the right choice.
The device is:
– Small & light: Fits in jacket pocket
– Intelligent: Measures almost all lag traps automatically
– Economical: 5–10× cheaper than traditional enterprise devices
– Practical: Two devices, wireless, simple workflow, reliable results
– Hamina-native: Integrated with Planner & Onsite Cloud
With Clip + Hamina you have a complete Wi-Fi assessment and optimization portfolio – scalable from remote overview assessment to detailed field troubleshooting.
→ Time to modernize Wi-Fi surveys.
Next Steps
1. Book free demo: Test Clip + Hamina Onsite
2. Technical data sheet: hamina.com/clip Clip specs & compatibility
Bonus TIP for Hamina Wireless Users:
The Network Status Heatmap – Everything at a Glance

With the latest version (20.01.2026) of Hamina Network Planner, there is now the Network Status Heatmap for everyone!
This functions as a “summary” (roll-up) of all other heatmaps – you see at a glance whether your network meets all requirements or not. The color coding immediately shows you how many heatmaps fail to meet your specifications.
What does “meeting requirements” mean?
In Hamina Network Planner you define a threshold value (highest acceptable value) for each heatmap.
Example Coverage: If you’ve set “-65 dBm”, coverage is considered met if it’s -65 dBm or better (i.e., e.g., -60 dBm = green, -70 dBm = red).
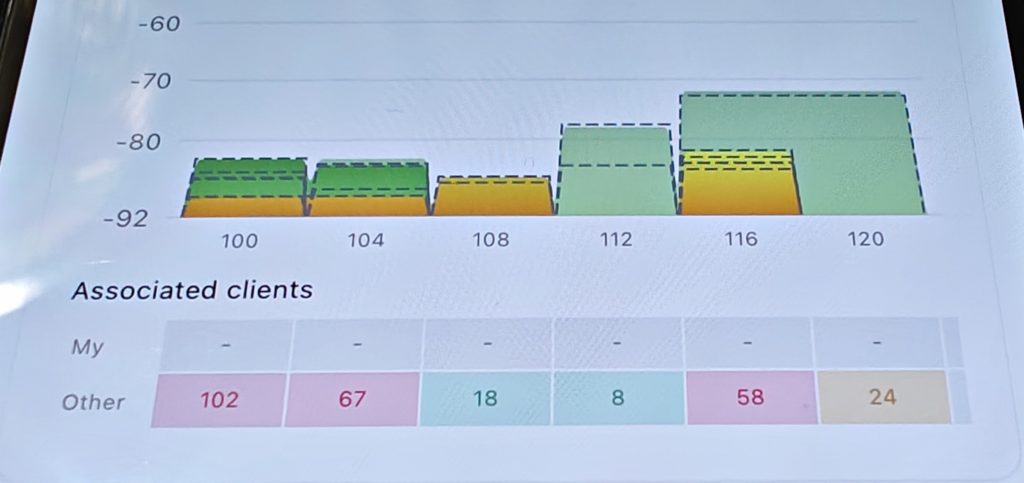
Typical standard threshold values (adjustable):
- Primary Coverage: Green ≥ -65 dBm, Yellow -70 dBm, Red < -75 dBm
in the example above -67 dBm - Secondary Coverage: Green ≥ -67 dBm, Yellow -70 dBm, Red < -75 dBm
in the example above -68 dBm - SNR: Green ≥ 25 dB, Yellow 20 dB, Red < 15 dB
in the example above met and therefore hidden - Interference: Green <2 APs, Yellow 3 APs, Red 4 APs
in the example above 4 APs - Channel Utilization: Green 0-30%, Yellow 30-49%, Red >49%
in the example above 50%
Enable/Disable Network Status
Want to include certain heatmaps (e.g., only Coverage + SNR) in the summary?
- Expand Legend menu (popover)
- Select “Global Settings”
- Activate/deactivate toggle switches at the bottom for each heatmap
Mouseover Inspector: Which requirement fails exactly?
Just like all other heatmaps, Network Status has a mouseover inspector: Hover over a spot and you see exactly which requirements are failing:
- “Coverage: -72 dBm (below -65 dBm) ❌”
- “SNR: 18 dB (below 25 dB) ❌”
- “Interference: 3 APs on channel 48 ❌”
Perfect for quick analysis: When Network Status is red, you immediately see what the cause is – and can optimize specifically.
#HaminaCLIP #HaminaWireless