Category: Clip

  • Hamina Clip After Eight Months: The Wi-Fi Survey Tool You Actually Carry

    Hamina Clip After Eight Months: The Wi-Fi Survey Tool You Actually Carry

    Executive Summary

    Eight months ago, I was skeptical about whether Hamina Clip could deliver beyond its specifications. I wanted to know whether such a small survey device would genuinely earn a professional role in real-world projects.

    Today, the answer is clear: Clip does not replace every large survey platform, and it certainly does not replace a true spectrum analyzer. But it has achieved something that often matters more in day-to-day work than the longest feature list: it is always with me, which means measurements actually get taken.

    After eight months, that is where I see its greatest value. Clip lowers the barrier between “We should check the Wi-Fi” and “I am measuring it right now.”

    From First Impressions to Everyday Use

    When I first introduced Clip, the main focus was its size, price, and cable-free workflow. My conclusion at the time was essentially this: Clip is the measurement head; the smartphone provides the intelligence —and together they form a remarkably agile survey system. In my first LinkedIn post, I described it as a serious option for anyone who had previously found professional Wi-Fi surveys too expensive. [1]

    Eight months later, I would phrase that somewhat differently:
    The price opens the door, but the low operational friction is what makes you walk through it.

    Professional survey tools only help when they are charged, within reach, and ready to use quickly. Clip weighs less than 290 grams, supports 2.4, 5, and 6 GHz, and connects to an iPhone, iPad, or Mac via Bluetooth Low Energy or USB-C. In practice, that changes the entire on-site workflow. [2, 3]

    No separate cable between the survey device or sensor and the tablet. No adapter assembly. No cable catching on door handles in the field.
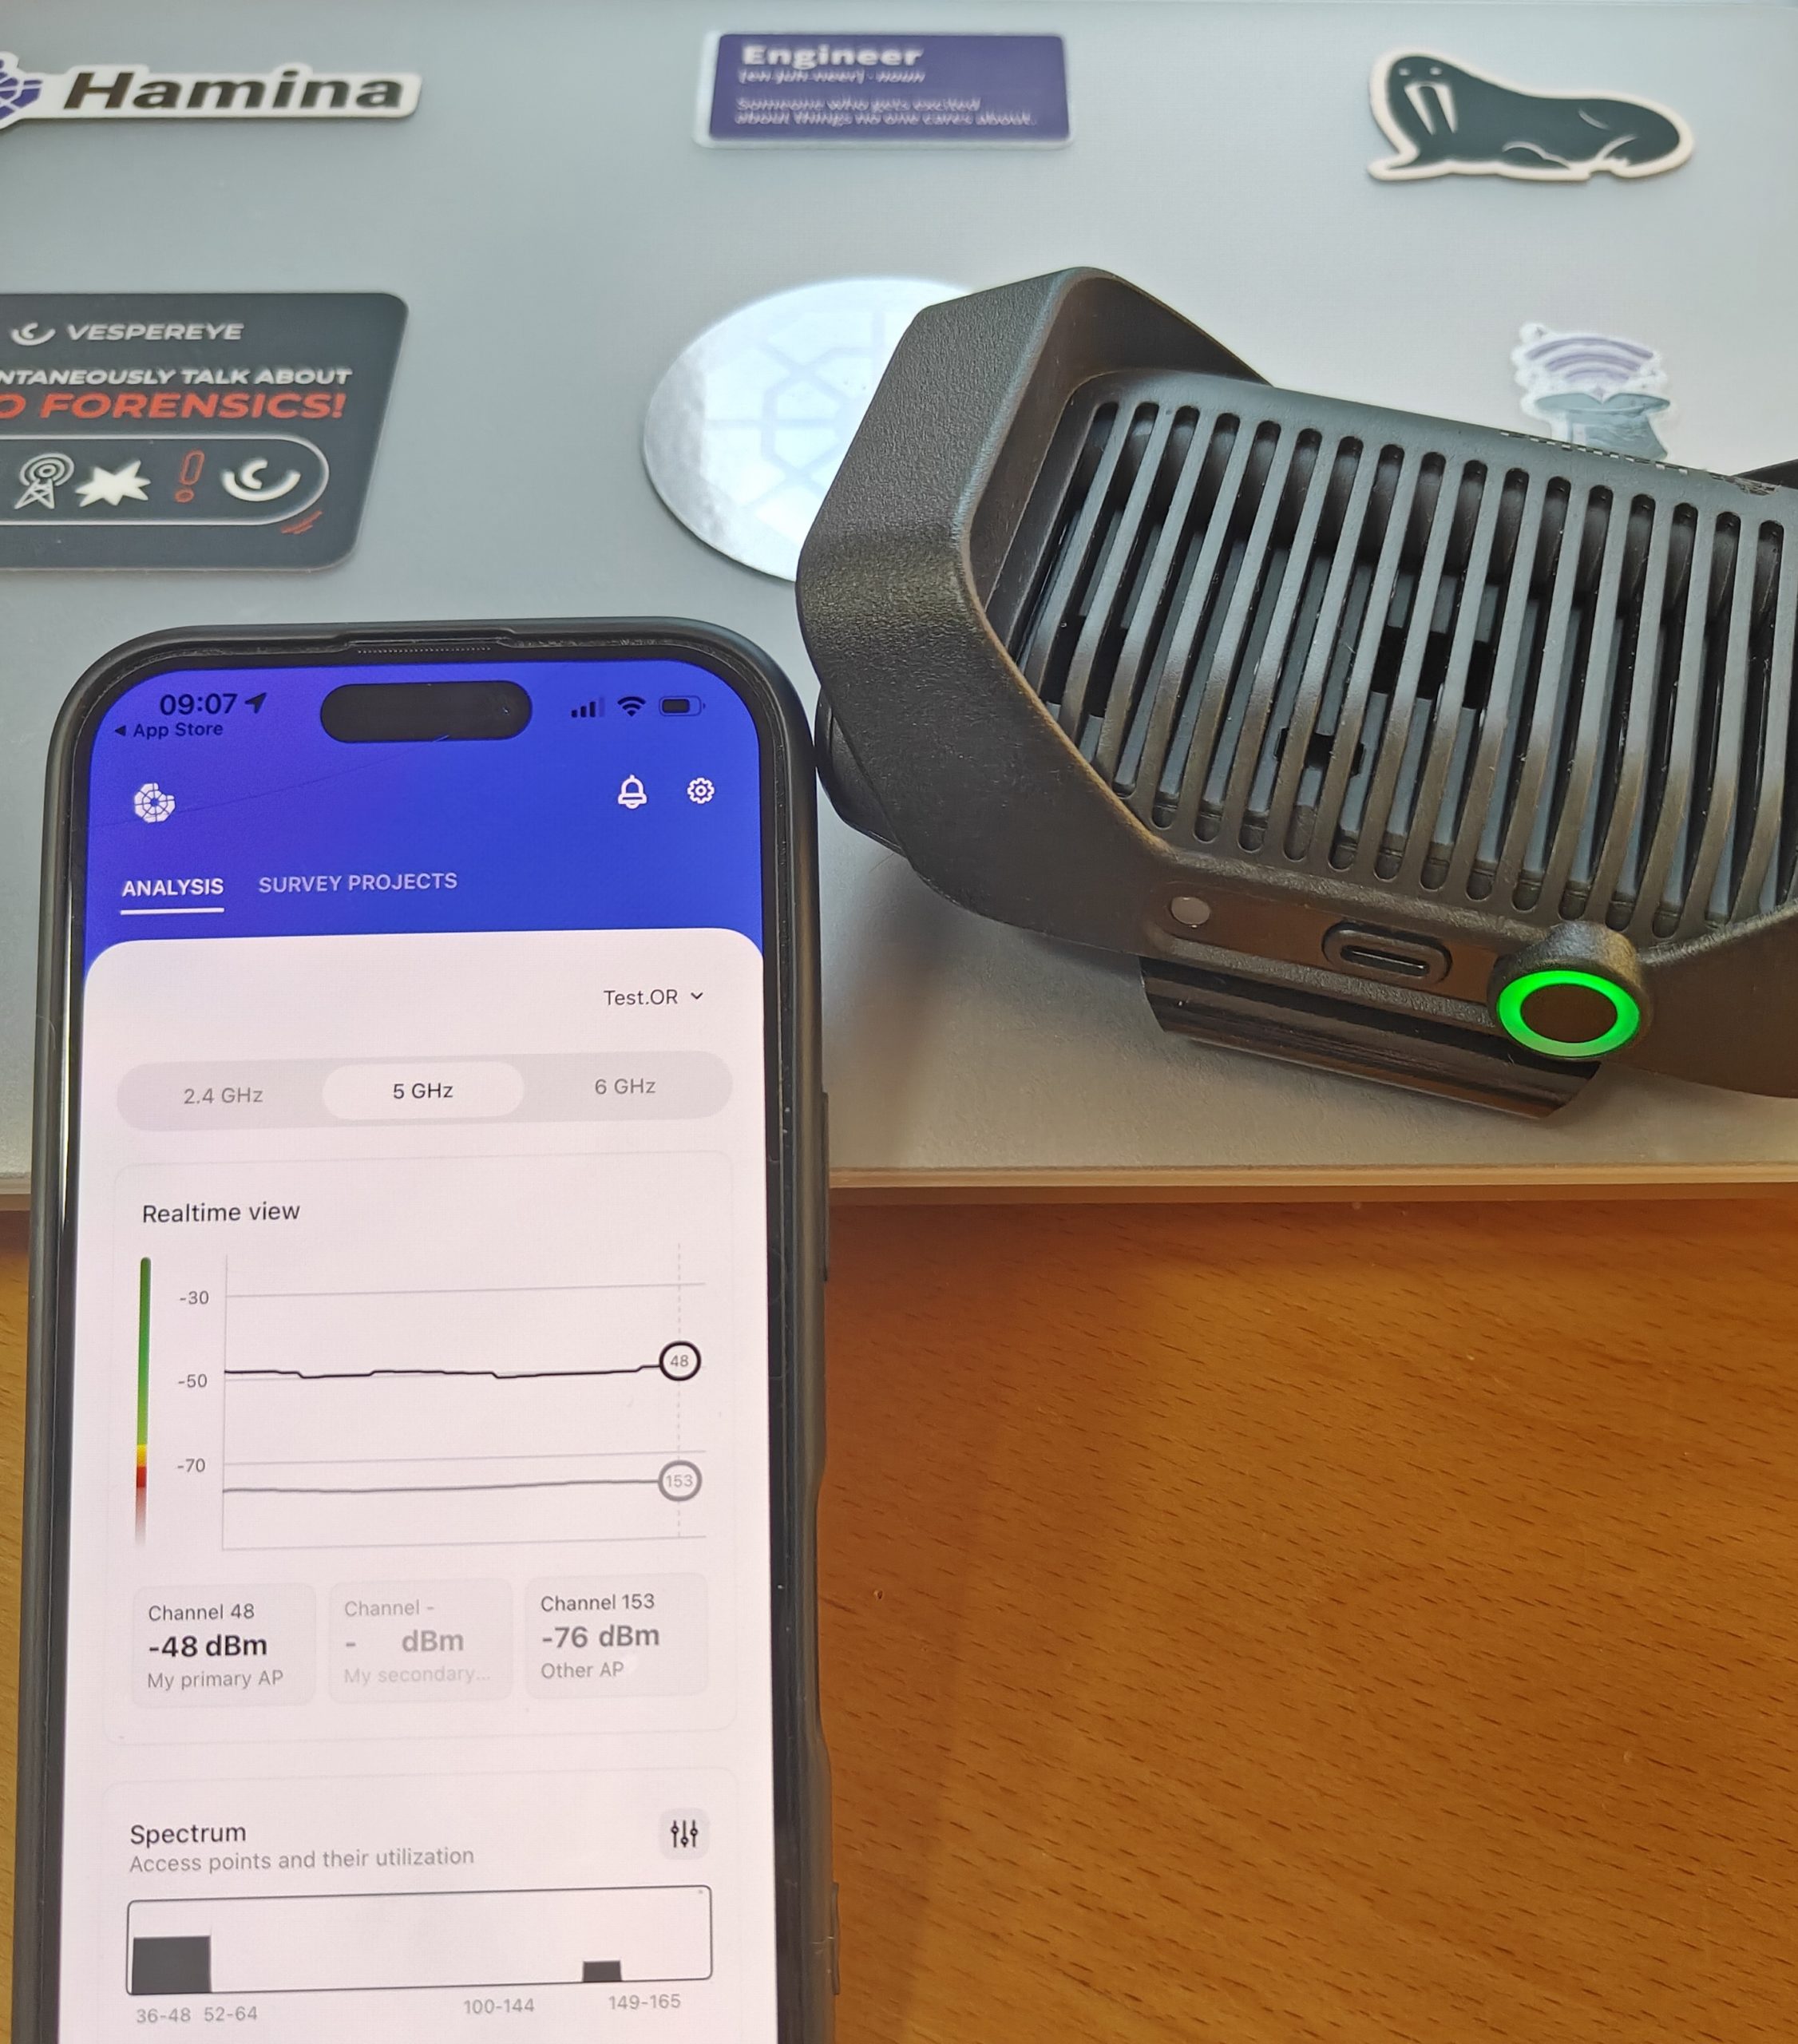
    Switch on Clip, open Onsite, and start working; manual pairing in the Bluetooth settings is not required. [3]

    Eight Months of Product Development

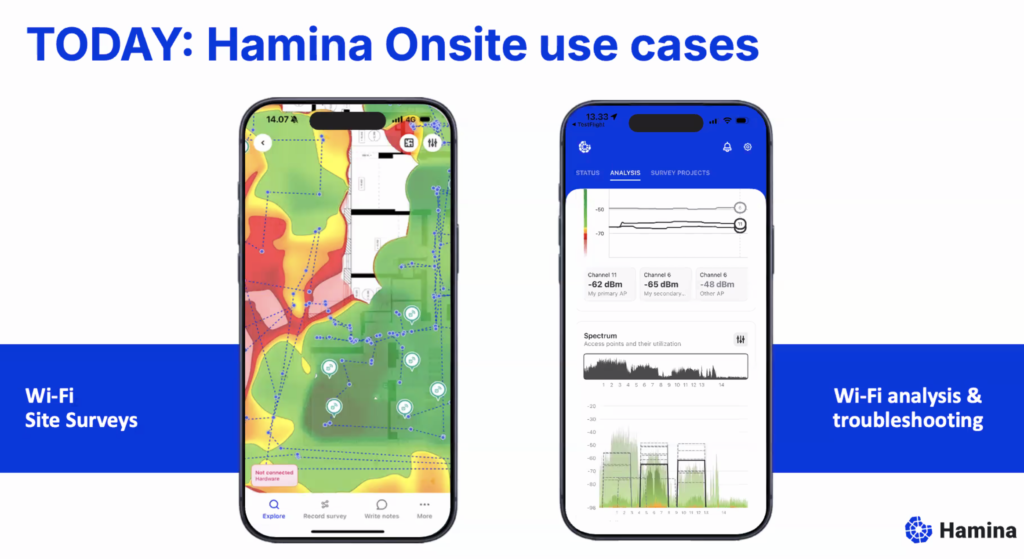
    When Clip was introduced at a cinema in Helsinki, it was more than new hardware. Hamina also announced a new generation of Hamina Onsite, featuring faster diagnostics, visualisation of connectivity and speed issues, AP localisation, and floor-plan-free surveys on supported iPhone and iPad Pro models. It was already clear that not every demonstrated feature would be complete on day one. [4]

    The extent of the system’s subsequent development becomes clear in the release notes. From the first documented update after the launch on 27 January through 29 September, Hamina published 39 dated release packages. Based on my analysis, 33 of them included at least one change or bug fix directly related to surveys, measured access points, heatmaps, Onsite, PCAP, Live View, or Orb. Pure additions to the AP and antenna database are not included. [5]

    Many improvements affect Planner, survey analysis, reporting, or Live View. That is precisely what matters in practice: Clip’s value comes from the full workflow, not only from the two radios in its enclosure. Anyone with further suggestions can submit new ideas at https://feedback.hamina.com/ and vote on which proposals should be implemented.

    The most important changes since January 2026 include:

    • Live View left beta in February.
      Orb RSSI and dedicated Live View reports followed shortly afterwards. [5]
    • Survey Explorer was expanded.
      Additions include channel utilization and more information about measured access points. [5]
    • Survey analysis became more detailed.
      Tertiary Coverage was added to survey reports, while heatmap calculation and Auto-Scope were later accelerated. [5]
    • AP and BSSID handling improved repeatedly.
      Measured APs can be merged manually, regrouped automatically, and split selectively when several BSSIDs are present; in late September, Hamina added grouping based on RSSI and TSF. [5]
    • Packet captures became part of the survey workflow.
      Since June, a PCAP can be downloaded directly from a survey session. [5]
    • Survey projects became easier to reuse.
      Since July, projects can be duplicated together with their survey data. [5]
    • Measured APs provide more context.
      Since August, Hamina has also shown the number of supported spatial streams for access points detected during site surveys. [5]
    • Orb and Live View became more tightly integrated.
      In addition to Orb RSSI, rating thresholds were adjusted, Orb names were used as fallbacks, and matched Orb clients were prioritized in the list. [5]

    My assessment after eight months therefore no longer concerns the same product that appeared on the screen in Helsinki. The hardware has remained largely unchanged, but its practical scope and the quality of the surrounding workflow have not. Hamina has gradually turned Clip into a platform that brings surveys, troubleshooting, packet capture, experience measurement, and continuous network monitoring closer together.

    What Has Really Changed

    The biggest difference is not the heatmap. Nor is it Wi-Fi 7.
    It is the willingness to start a measurement in the first place.

    Previously, a survey was more often a deliberately planned task: prepare the hardware, pack the bag, check the cables, charge the tablet or notebook, and then carry the complete setup through the building. With Clip, this special appointment has much more often become a routine part of the work, thanks to the tool’s ease of use and speed.

    This is most apparent in four situations:

    • Post-deployment validation: Immediately after installation, the measured RF coverage can be checked against the design and defined requirements.
    • Troubleshooting: For a specific complaint, measure first before making assumptions about access points, channels, or transmit power.
    • AP-on-a-Stick: Real measurements from a temporarily positioned access point supplement or correct the simulation before final installation. My experience and most vendors’ best practices explicitly describe this approach as the basis for reliable heatmaps. [6]
    • Spot checks: Even when no full survey is planned, individual measurement points or short walks quickly provide a more objective picture than a smartphone’s Wi-Fi indicator or an isolated speed test.

    Hamina Onsite updates heatmaps during measurement and displays Primary and Secondary Coverage, SNR, and Wi-Fi-based interference information. This is critical in the field: if an area looks implausible, I can immediately remeasure it, verify the floor plan, or add another survey path. Errors do not remain hidden until post-processing hours later. This also accelerates team surveys of large environments and provides immediate visual feedback. [7]

    The Invisible Advantage

    In offices, railway stations, trains, hotels, or public spaces, technical quality is not the only consideration. The way the equipment appears to other people will affects the workflow.

    A large measurement device with cables attracts attention and questions. Clip attaches to a belt, backpack, or strap and is barely noticeable. That may sound trivial, but it is a genuine productivity factor: I can focus on my position on the floor plan, walking pace, and measurement data instead of continually explaining the hardware.

    This effect was already apparent during the first deployments. After eight months, I consider it one of the most important advantages of the entire concept. [2] [7]

    Two Radios Are Surprisingly Often Enough

    At launch, one question arose immediately: are two tri-band radios sufficient for professional surveys?

    The larger Oscium Nomad uses four radios and remains the more capable platform for certain demanding tasks. Hamina deliberately positions Clip differently: two radios are sufficient for fast surveys, including larger sites, provided the scanning algorithm is suitably optimized; Hamina explicitly qualifies this claim for extreme environments such as a fully occupied stadium. [8]

    My experience is similar. In typical office, retail, warehouse, and troubleshooting scenarios, the lower radio count affected the workflow far less often than I initially expected. What matters most is a consistent survey pace, accurate positioning on the floor plan, and a survey path suited to the environment.

    Even so, two radios do not become four. Anyone who must monitor several channels simultaneously, assess very large high-density environments, or perform in-depth spectrum analysis should not replace Nomad or another specialized platform prematurely. After eight months of experience, however, these scenarios have proved considerably less common than I initially expected.

    The Workflow Matters

    A continuous survey looks simple: walk, tap the floor plan, and collect data. Even so, a good survey still requires sound technique.

    The app distributes the readings collected during a straight path segment along that route. Walking speed, start and end points, and changes of direction must therefore be recorded accurately. Doors, conversations, stairs, and crowded corridors do not make a survey impossible, but they do require attention.

    After eight months, the following straightforward workflow has proved effective for me:

    1. Prepare the project: Check the floor plan, scale, requirements, and relevant SSIDs before arriving on site.
    2. Charge Clip and the client device: The specified runtime is more than five hours, which is achievable depending on the environment. During longer sessions, Clip can be charged over USB-C while measurements continue. In practice, I always carry a power bank so I can top up during short breaks or even charge Clip while it is attached to my belt. [9][2]
    3. Start with a sanity check: Do the detected BSSIDs, bands, channels, data rates, and signal levels broadly match expectations?
    4. Choose the appropriate survey mode: Use point measurements for critical locations and line or continuous surveys for connected areas.
    5. Remeasure anomalies immediately: A red area is initially an indication, not a diagnosis.
    6. Separate RF conditions from user experience: Good coverage proves neither low latency nor reliable application performance.
    7. Identify the cause before making changes: Do not change the channel, transmit power, or AP location solely because a heatmap looks attractive or unattractive.
    8. Validate again after every change: Otherwise, the configuration was changed but the improvement was not demonstrated.

    The key lesson is this: Clip makes surveys easier and, above all, more accessible, but it cannot turn poor measurement methodology into good methodology.

    More Than Hamina Onsite

    In everyday use, Clip became more interesting to me once it was no longer merely a sensor for Hamina Onsite.

    Wi-Fi Explorer Pi supports Clip as an external sensor on iPhone and iPad. This matters because iOS apps provide almost no direct access to the required Wi-Fi information. The external sensor performs the scanning, making professional mobile analysis possible in the first place. This combination is highly practical for quickly inspecting BSSIDs, channels, security, signal levels, and information elements. [10]

    Support for Clip was also added to Airtool 2 in May, extending its role from survey sensor towards packet capture and detailed protocol analysis. It does not replace a purpose-built capture setup for every special case, but it makes Clip a more versatile tool that is more likely to remain in the backpack. [11]

    This combination is exactly what matters to me: Onsite for surveys and validation, Wi-Fi Explorer Pi for rapid Wi-Fi analysis, and Airtool for packet captures. The value lies not only in a single app, but in reusing the same compact hardware across several workflow stages.

    RF Meets User Experience: Orb in Onsite

    One of the most important additions for me in recent months is the Orb integration in Hamina Onsite. It closes a gap that repeatedly appears in conventional Wi-Fi surveys: a good RF heatmap does not prove that the network also feels good to the user.

    Clip primarily describes the RF environment. It provides data on signal level, SNR, coverage, redundancy, and Wi-Fi interference. Orb, by contrast, examines the usable end-to-end connection path and evaluates the experience in terms of Responsiveness, Reliability, and Speed. These metrics produce an Orb Score from 0 to 100. [12][13]

    In Hamina Onsite, this capability is integrated directly into the mobile workflow.

    This combination is particularly useful in troubleshooting because it prevents premature conclusions. A high throughput result in a conventional speed test can conceal brief interruptions, packet loss, or poor responsiveness. Orb instead uses continuous, lightweight measurements and consolidates Responsiveness, Reliability, and Speed into a single score. [14][13]

    For my practical workflow, this means:

    1. First, I use Clip and the Onsite app to assess the RF environment.
    2. I then compare any anomalous areas with the Orb Score and the underlying connection metrics.
    3. If the RF and Orb views do not align, I extend troubleshooting beyond the Wi-Fi network.
    4. After a change, I repeat both assessments instead of looking only at the signal heatmap.

    It is important to distinguish between two integrations:

    • Orb in Hamina Onsite accompanies the active on-site survey.
    • Orb in Hamina Live View connects permanently installed Orb endpoints to a Planner Plus project through an API and enriches client data with Orb Score, lag, packet loss, and other end-to-end metrics. Onsite is therefore the tool for mobile field work, while Live View extends the same concept towards continuous operational monitoring. [15][16][4]

    For me, this connection makes the Clip workflow more complete: the sensor shows what is happening over the air, while Orb shows what reaches the user. It creates a genuine link from OSI Layer 1 to Layer 7.

    What Clip Is Not

    After eight months, an honest field report also requires clear boundaries.

    Not a Spectrum Analyser

    Clip can provide highly useful information about channels, BSSIDs, signal levels, and Wi-Fi-based utilization. Almost all modern Wi-Fi access points also provide basic channel-utilization data, which the Hamina Onsite app displays. In most cases, this provides considerable insight without a true analyzer. Because the effects of RF interference on the Wi-Fi infrastructure can be observed, a spectrum disruption becomes indirectly visible.
    However, Clip does not measure raw RF energy like a true spectrum analyzer. Hamina explicitly states this limitation: raw spectrum data requires, for example, a Nomad with a supported external spectrum analyser. [7][2]

    A microwave oven, video transmitter, or other non-Wi-Fi interference source therefore cannot be conclusively diagnosed from a Wi-Fi heatmap alone. In most practical deployments, however, this is not essential because the relevant effects on the network are usually already visible.
    If such causes are suspected, the appropriate additional tool is required.

    Not a Substitute for Expertise

    A heatmap is a visualization, not a complete root-cause analysis. Poor primary coverage, excessive secondary coverage, co-channel contention, unsuitable channel widths, and problematic roaming behavior can look similar while requiring different corrective actions.

    Clip lowers the barrier to professional measurements. It does not remove the need to understand the underlying physics or the responsibility to define meaningful requirements and suitable configurations.

    Not Standalone Proof of Good Application Performance

    Passive site surveys provide particularly extensive RF data because the sensors capture beacons and other management information from visible networks. However, this does not automatically prove that DNS, DHCP, WAN, VPN, SaaS, gaming, SAP, or videoconferencing performs well. [17]

    Orb integration broadens this perspective considerably, but it remains one diagnostic component. A good Orb Score indicates a good measured end-to-end experience; it does not automatically prove that every business-critical application and every possible client operates without issues. RF data, Orb metrics, and application-specific tests should therefore be considered together.

    Wireless over BLE, or Wired After All?

    The wireless connection is Clip’s central advantage and has proved remarkably unobtrusive in everyday use. That is how infrastructure should work: attention stays on the customer’s network rather than on the transport path between sensor and display.

    Even so, USB-C remains useful. In particularly challenging RF environments, during long sessions, or when no risk of interruption is acceptable, the cable is not a step backwards but a pragmatic option. In the survey linked from my iX article, the BLE connection was stress-tested with more than 600 SSIDs and performed remarkably unobtrusively even seven months ago. [3] [21]

    After eight months of field use, my rule is: BLE is the default; USB-C is the fallback.

    Small Hardware, Greater Impact

    My first article about Clip focused heavily on the fact that professional Wi-Fi validation does not automatically require a large and expensive measurement device. I later summarized it even more briefly on LinkedIn: “If you do not validate, you lose.” The iX review shared with that post likewise positioned Clip as a compact Wi-Fi validation tool. [18]

    After eight months, I would add this: if validation happens only when the complete specialist equipment has already been scheduled, it happens far too rarely in practice.

    Clip does not change the physics. It changes the behavior of the Wi-Fi planner or engineer. Because the tool is compact, quick to deploy, and versatile, assumptions more often become measurements, and configuration changes become demonstrated improvements for users.

    My Conclusion After Eight Months

    Hamina Clip is not my only Wi-Fi tool, but it is the tool I always carry.

    For complex spectrum analysis, extreme high-density environments, or tasks requiring maximum parallel capture, larger and more specialized systems remain appropriate. For most of my usual validation, AP-on-a-Stick, and troubleshooting tasks, however, Clip has proved highly practical and sufficient.

    The three main reasons are:

    • It is small enough to be carried in practice.
    • It is quick enough to deploy that even short measurements are worthwhile.
    • With Hamina Onsite, Wi-Fi Explorer Pi, and Airtool, it supports several professional workflows on one hardware platform. [20][10][11]

    My most important statement from the first article therefore still stands:

    Clip is the measurement head; the smartphone provides the intelligence. What matters is having both available at the right moment.

    Anyone who regularly designs, installs, operates, or troubleshoots Wi-Fi should not ask whether Clip replaces every other tool. The better question is:

    How many problems could I have measured sooner over the past eight months if a professional sensor had always been in my bag?

    References

    1. Falk Bachmann – haminaclip – Falk Bachmann Connectivity Architect | 20+ Yrs Wired/Wireless Expert (CCIE/CWNE/HCNA) | Making netwo…
    2. Hamina Clip – Wi-Fi Site Survey and Troubleshooting Device – Hamina Clip is a compact, tri-band Wi-Fi site survey device built for professionals—fast, cable-free…
    3. Hamina Clip – Knowledge Base / Manual
    4. To end bad Wi-Fi, Hamina introduces an easy, affordable Wi-Fi site … – Discover Hamina Clip, a compact, AI-powered Wi-Fi diagnostics tool that simplifies network troublesh…
    5. Hamina Release Notes
    6. How to do AP-on-a-Stick Surveys – AP-on-a-Stick (APoS) uses measurements from real AP placements to create heatmaps, which can then be…
    7. Hamina Onsite I The most reliable site survey solution – Hamina Onsite + Oscium Nomad. The most reliable site survey solution. Validate, troubleshoot and see…
    8. WLPC Phoenix 2026: Here’s What You Missed – Blog – Hamina – The Hamina team kept busy at WLPC Phoenix 2026 with four presentations covering everything from site…
    9. 2026 Mid-Year Recap: Clip, AI-Powered Design, Real-Time … – Discover Hamina Wireless’s latest innovations, including the Hamina Clip, AI-powered Wi-Fi design to…
    10. Wifi Explorer – DISCOVER • ANALYZE • TROUBLESHOOT See every Wi-Fi network clearly. Scan nearby networks, inspect cha…
    11. Airtool 2 Release Notes – Airtool 2 Release Notes Known Issues Capturing with the built-in Wi-Fi adapter on Macs equipped with…
    12. Orb Datasets – Reference documentation for Orb dataset schemas including Scores, Responsiveness, and Speed data.
    13. Orb Cloud – View, manage, and analyze your Orb network data in the cloud with analytics, status monitoring, and …
    14. Why is my Wi-Fi bad? And how do I fix it? Complete … – Blog – Put simply, an Orb Score over 80 is considered good, while over 90 is great. Hamina has now integrat…
    15. Orb – Hamina Knowledgebase
    16. Orb for Hamina Live View – This integration displays Orb Score and lag measurements for Orb-equipped client devices alongside y…
    17. Site Surveys – Hamina Onsite can also display a heatmap live while you survey, giving you instant feedback about wh…
    18. Falk Bachmann – Compact Wi-Fi Validation Tool in Review – Hamina Clip: Compact Wi-Fi Validation Tool in Review. Falk Bachmann Connectivity Architect | 20+ Years Wired/Wireless Expert…
    19. Hamina Clip: Compact Wi-Fi Validation Tool in Review – Hamina Wireless has launched Clip, a compact measurement device for Wi-Fi site surveys…
    20. Hamina: Sample Report for a Public Building
    21. iX article: Compact Wi-Fi Validation Tool: Hamina Clip
  • Hamina CLIP: The Smart Measurement Duo for Professional, WIRELESS Wi-Fi Surveys

    Hamina CLIP: The Smart Measurement Duo for Professional, WIRELESS Wi-Fi Surveys

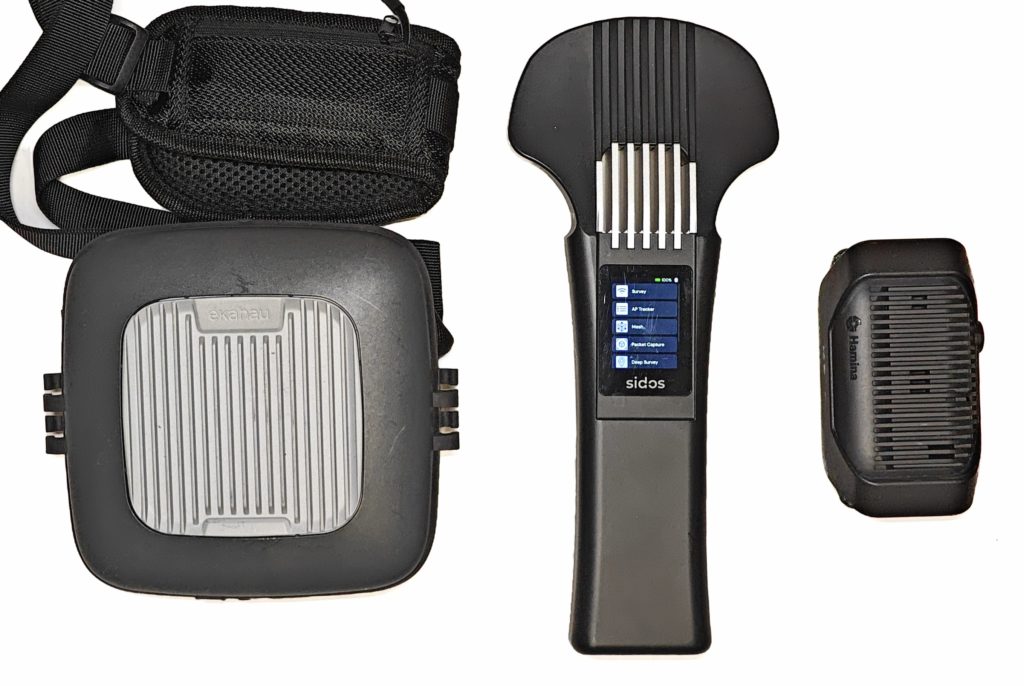
    Left: a foam model of a well-known measurement device (Ekahau Sidekick2) – Right: Hamina Clip

    Executive Summary

    Wi-Fi surveys don’t have to be bulky and complicated. Clip is a lightweight, wireless measurement device that, together with a smartphone app, becomes an agile survey tool. With only two radio modules instead of four – and therefore significantly cheaper compared to previously available professional alternatives. What initially sounds like a disadvantage turns out to be almost irrelevant in practice. Here, the Oscium Nomad, the SIDOS Wave or the Sidekick series from Ekahau should be mentioned, which are in a different price segment and thus also a different performance range. – Clip is aimed at technicians, IT admins and network professionals who need to work quickly, discreetly and reliably. Real-world practice over the last few days with the CLIP clearly shows that the main advantage lies in the size and invisibility during measurement. This massively accelerates and simplifies the actual measurement workflow on-site.

    Comparison Ekahau Sidekick – SIDOS Wave – Hamina Clip

    Clip works wirelessly & seamlessly with Hamina Wireless (Planner & Onsite) and enables:

    – AP-on-a-Stick Surveys (validate planning before installation)

    – Post-Installation Validation (does the coverage really fit?)

    – Live Troubleshooting (respond quickly to complaints)

    – Systematic Lag Trap Identification
    (Co-Channel Interference, Roaming Gaps, TX-Power Errors, Jitter)

    Unlike fully automated remote solutions like SIDOS Deep Survey, the survey process with Clip remains somewhat more labor-intensive and requires two devices – but offers maximum control in the field with cost-effective flexibility.


    The Problem: Bulky Survey Devices vs. Practical Field Reality

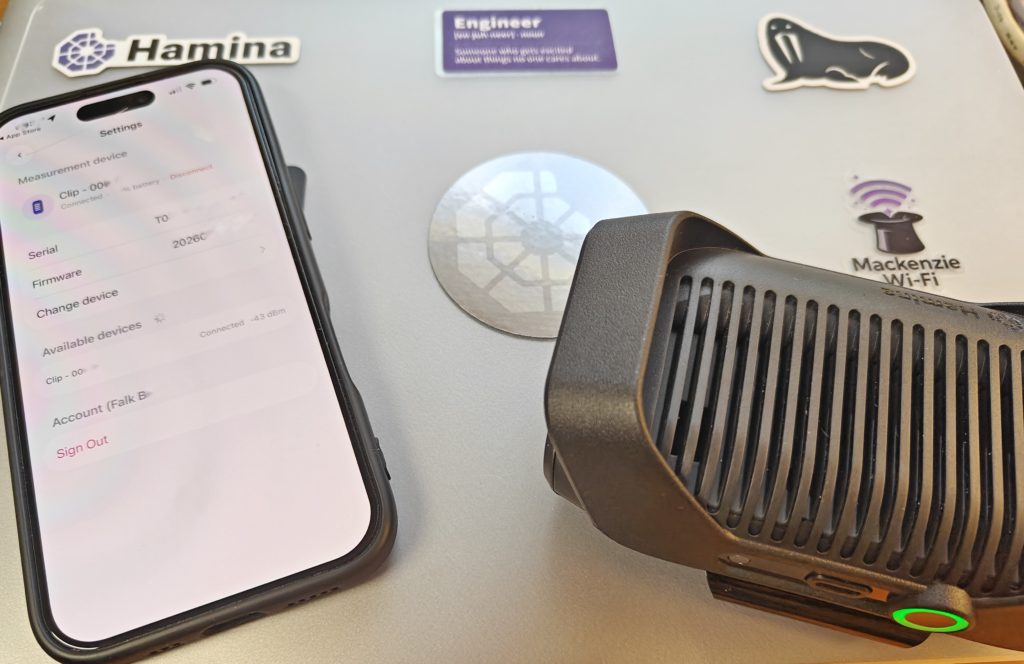
    iPhone 16 paired via Bluetooth Low Energy with Hamina Clip

    Classic Wi-Fi site surveys demand compromises:

    Scenario 1: Large Survey Equipment

    – iPad/Laptop, external measurement card/Sidekick, cables, power supply

    – Conspicuous, bulky, impractical in buildings

    – Setup takes 10+ minutes until the first measurement runs

    – Cost: €3,000 – €8,000 for hardware alone

    Scenario 2: Remote Assessments (e.g. SIDOS Deep Survey)

    – Save costs (under €200 per survey)

    – But: No on-site control, no live adjustments

    – Ideal for overview assessments, not for detailed troubleshooting

    Scenario 3: Smartphone App Alone

    – Practical in the field

    – But: Too weak for professional measurements

    – No reliable capture of all APs, frequency bands and metrics

    Clip addresses exactly this gap.

    It combines the flexibility and lightness of a smartphone setup with the measurement accuracy of professional devices – at a fraction of the cost.


    What is Hamina CLIP?

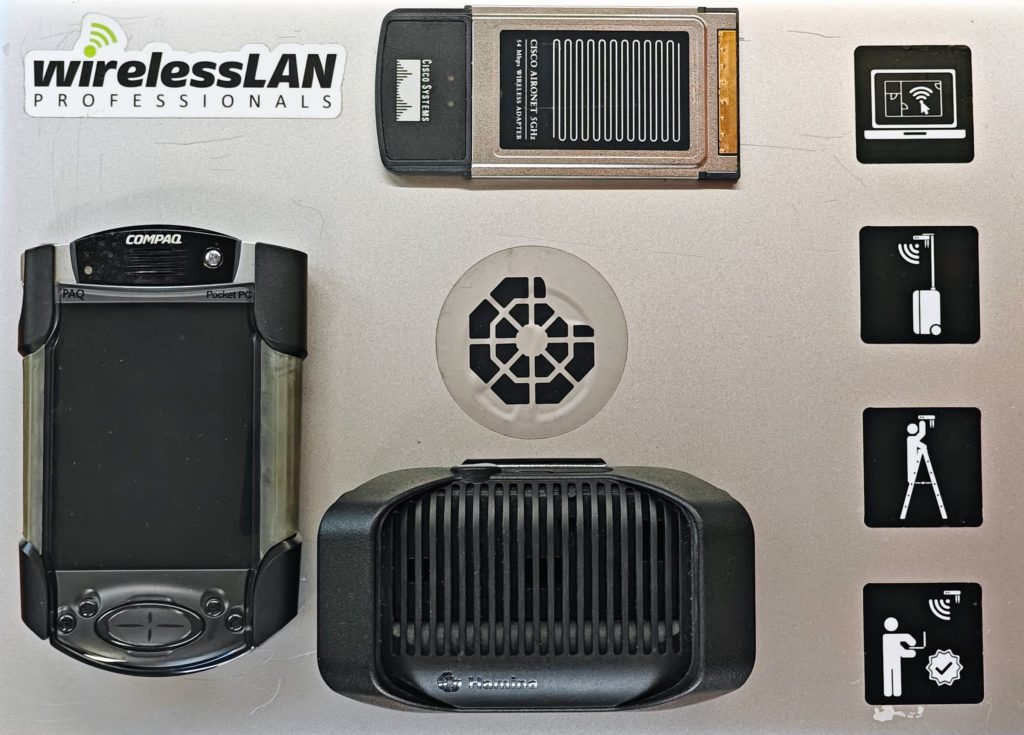
    Hamina Clip in comparision with Compaq iPaq and 802.11a Cisco PCMCIA Card

    Core Concept: The Intelligent Measurement Duo

    Clip consists of two components that together form a professional survey system:

    1. Clip Device (Hardware)

    – A small, lightweight, portable Wi-Fi measurement device with 2 radio modules
    (instead of 4 like the Nomad from Oscium)

    • Lightweight, discreet, wireless
    • easily attachable anywhere with belt clip
    • Directly connected to iPhone/iPad/MacBook via BLE or USB-C
    • Measures Wi-Fi signals, interference, SNR on all bands (2.4, 5, 6 GHz)
    • Supports Wi-Fi 6, Wi-Fi 7 and is Wi-Fi-8-ready
    • Supports PacketCapture

    2. Hamina Onsite App (Smartphone/iPad/MacBook)

    – iOS app for iPhone/iPad/MacBook

    – Connects to Clip via BLE or USB-C

    – Shows live heatmaps, coverage images, interference maps

    – Integrates directly with Hamina Network Planner cloud projects

    – Works truly wirelessly – data synchronizes via BLE to smartphone and to the cloud

    The principle: Clip is the measurement head, your smartphone is the intelligence. Together a team.

    Here’s much more to expect in the near future, something was already shown at the launch event watch here.


    How Clip Works in the Field

    iPhone and Hamina Clip with the Onsite App

    Step-by-Step in Daily Use

    Setup (5 Minutes)

    1. Open Hamina Onsite App

    2. Load existing Hamina project (from cloud or offline copy)

    3. Connect Clip to iPhone/iPad via USB-C only necessary the first time

    4. BLE pairing is set up

    5. Unplug USB-C cable again

    6. App confirms connection → “Survey ready”

    No laptop. No cable mess. No login chaos.

    Conduct Survey (15–60 minutes depending on size)

    Three measurement modes (like with the Oscium Nomad):

    Point Measurement (Point Survey)

    – Stand still at critical locations (meeting room, cafeteria, dead zone)

    – Tap app button → measurement starts for 5–10 seconds

    – All APs, SNR, interference are captured

    – Point is marked on the building plan

    – Live heatmap shows how coverage is composed

    Line Measurement (Line Survey)

    – Walk the path, iPhone in hand

    – App records continuously

    – A data point every 1–2 meters

    – Ideal for corridors, stairs, warehouses with long shelves

    How does a line measurement work?

    When you tap on the map and begin walking in a straight line, the measurement device (Clip/Nomad) scans all active channels and streams the data in real-time to the Hamina Onsite App. The app stores the measurement points in a temporary buffer.

    As soon as you tap on the map again at the end of the line, Hamina Onsite distributes the collected measurement points evenly along the line. That’s why a consistent walking pace is so important!

    Continuous Measurement (Continuous Survey)

    – Clip runs continuously, app in background

    – Perfect for “walk-through troubleshooting”

    – Every position is linked live with data

    A continuous measurement is basically a chain of line measurements. The advantage: You can measure very quickly and create a very data-rich recording! The disadvantage: It requires practice, coordination and quick orientation to perform it well.

    How to perform a continuous measurement:

    Find starting point: Look for a location on the map where you want to start the measurement. Note: As with point measurement, you may need to use reference points (windows, doors, room centers) to determine your exact position.
    Tap on the map and immediately start walking in a straight line at a consistent pace. Tap the map again at every stop, start, or direction change. Always walk consistently between taps. If errors occur (e.g., wrong tap), press the “Undo” button to undo the last tap.
    Press the “Stop” button when you’re done.

    Tip for crowded rooms: A helper who walks ahead, clears paths, answers questions from passersby, and opens doors. This makes survey life significantly easier.

    How does a continuous measurement work technically?

    When you tap on the map and begin walking in a straight line, the measurement device (Clip/Nomad) scans all active channels and streams the data to the Hamina Onsite App, which stores it in a temporary buffer. When you stop, start, or change direction and tap the map again, Hamina Onsite distributes the measurement points evenly along the last section. That’s why consistent walking pace is so crucial!

    “Ok, I understand now. I walk somewhere, stop, tap on the map, and then continue?”

    No! Tap when you start, stop, or change direction. That means: When changing direction, continue walking and tap on the map when you change direction. If you do it right, your gait looks somewhat robotic – which could be useful for the robot wars of the 90s. 🤖

    “Got it. But I always have to walk consistently, right?”

    Between taps, yes. You can change pace at each tap. The key: consistency between taps. Tap on the map and walk slower to gain time to plan your next section. 🧠

    Navigating Obstacles

    When you need to pause at an obstacle (e.g., door), here’s how:
    Walk to the door and tap on the map just before stopping.
    While you’re standing (getting keys out, opening door, etc.), Hamina continues collecting measurement points. Door open, ready to walk through? Tap the same point on the map and continue walking.
    Why this is genius: While you’re standing in front of the door, Hamina collects many measurement points that are then averaged. The measurement at this location (or where you talked to someone) becomes extremely precise! Works for any obstacle – even if you just want to pause briefly or reorient yourself.

    Live Heatmaps in the Field

    While you survey, your smartphone already shows the results:

    – Coverage Heatmap: Where is the signal good, where weak?

    – Interference Maps: Too much overlap? Neighboring APs in the way?

    – SNR Map: Signal-to-Noise Ratio per zone

    – AP Detection: All detected APs with channel, power, clients

    → You recognize problems immediately and can correct them, not days later during evaluation.


    Field Documentation with Hamina CLIP

    The Onsite App allows:

    • Notes/comments directly on the map (“There’s a metal roof here – signal drops”)
    • Photos of critical spots (misplaced AP, dead zone), directly with location in building plan and cloud synchronization
    • Marking of problems

    This saves you from guessing later: “Why was this spot bad again?”

    Synchronization to the Cloud

    Back in the office:

    1. The measurement data is directly available in Hamina Survey

    2. Deeper analysis available in the web UI

    3. Comparisons with previous surveys, trend analyses

    4. Share or export for reports, PDF, documentation of changes


    Clip in the Hamina Wireless Ecosystem

    Heinrich the moose and Hamina Clip

    Three Phases of Network Life

    Phase 1: AP-on-a-Stick Surveys (Design Validation)

    Problem: You’ve planned a network in Hamina Planner. But does it really fit?

    Solution with Clip:

    – Mount AP physically on a tripod (e.g., with a Wi-Fi Stand from the kit: https://wlan-manufaktur.com/products/apos-site-survey-set)

    – Walk around with Clip and smartphone

    – Real-time heatmap shows actual coverage

    – Compare with planning: “Does it fit or do we need to move the AP?”

    – Be sure before final installation

    Time saved: Instead of “build first, regret later” – now “validate beforehand”. Cost savings from one misplaced AP: €500 – €2,000.

    Phase 2: Post-Installation Validation

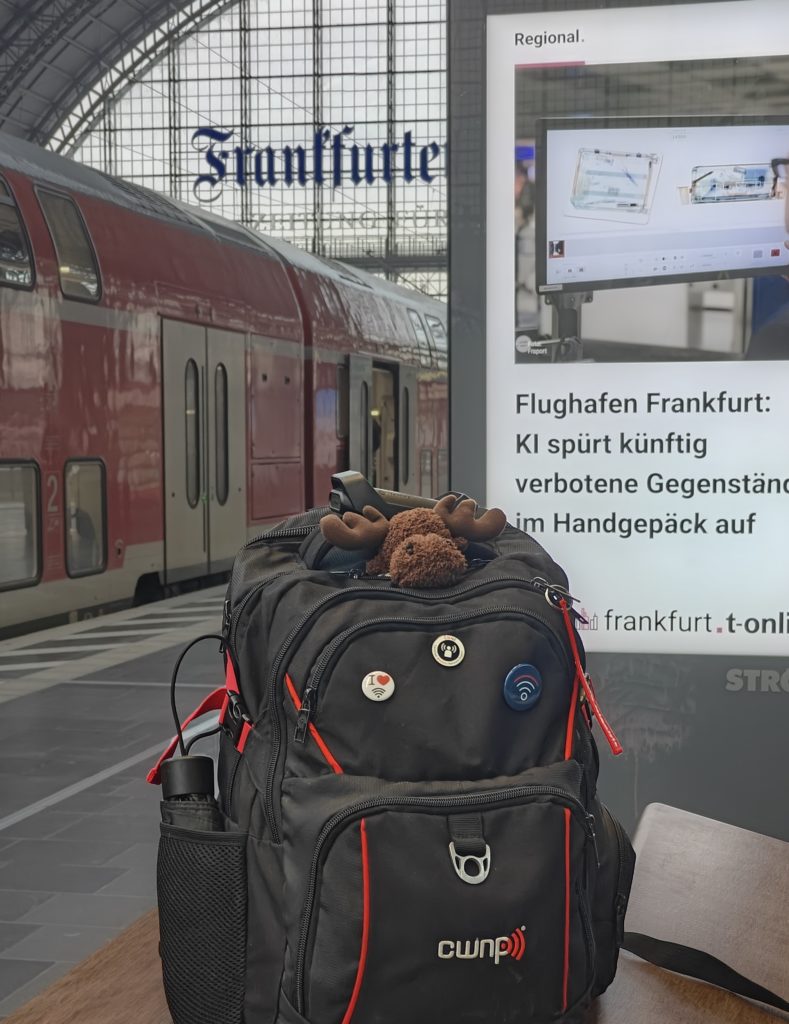
    Hamina CLIP attached to backpack, strictly monitored by Heinrich the moose

    Problem: APs are installed. Does the network meet requirements?

    Solution with Clip:

    – Turn on all APs/radios, start Clip survey

    – Live heatmap shows: Are there dead zones? Too much overlap? Poor roaming paths?

    – Correct immediately (power, channel, antenna orientation) and revalidate

    – Generate precise documentation for clients/audits

    Time to handover: 2 hours instead of 2 days (because no post-processing delay due to long PDF reports).

    Phase 3: Live Troubleshooting & Monitoring

    Problem: User complains: “Wi-Fi is always bad here.”

    Solution with Clip:

    1. Quickly go to the problematic location with Clip & smartphone

    2. Start Onsite App → analyze live data

    3. Interference? Co-channel APs? Signal too weak?

    4. Cause identified in minutes instead of guessing

    5. Perform on-site correction and validate area

    Example: “The conference room had too much interference from APs in the U-NII-1 band. Channel switch to DFS channel, re-measured, problem solved.”


    Clip vs. Oscium Nomad: The Hardware Perspective

    Here’s the honest comparison table:

    ClipOscium Nomad  Winner 
    Price990 $/€ incl. Cloud 6 months $ 1710 without Cloud licenseClip ✓ 
    Radio Modules24Nomad ✓ 
    Antennas48Nomad ✓ 
    Size/Weightvery small (iPhone size), 282 gCompact, 2 x Clip, 415 gClip ✓ 
    Battery Life6 h4 hClip ✓ 
    Charge and MeasureYESYEStie
    Wi-Fi 7 / 8 ReadyYESYEStie
    Spectrum AnalysisBasic
    (Wi-Fi chip based) 
    Optional (ext. device)Nomad ✓ 
    Target AudienceDaily surveys, AP stick, troubleshootingEnterprise deployments, complex RFClip for 80% of use cases ✓ 
    Comparison between Clip and Nomad

    Interpretation

    Clip wins at:

    – Cost (important for SMB, integrators, freelancers)

    – Discretion in the field (no “Why-are-you-holding-that-thing? What’s that on the belt and why does it have a cable to the iPhone/iPad?” looks)

    – Battery life nearly endless
    (longer surveys without breaks, wireless measurement & USB-C charging simultaneously)

    – Everyday usability (smartphone app without cable feels significantly more natural)

    Nomad wins at:

    – Parallel scanning
    (4 radios can monitor different channels simultaneously)

    – Full spectrum analysis
    (important when non-Wi-Fi interference could be a problem)

    – Enterprise requirements
    (very large-scale surveys, extreme environments – translated, what’s worse than trains, train stations, airports or warehouses? Yes, that works wonderfully with the CLIP – If you don’t believe it, just get in touch.)

    Rule of thumb: If you do 2+ surveys per month and cost is important → Clip.
    If you analyze highly complex RF environments and need spectrum details → Nomad + Spectrum Adapter


    Clip Addresses the Same Lag Traps as Deep Survey

    Wi-Fi Survey with CLIP at Frankfurt Main Station as an example of a challenging RF environment

    If the topic of Deep Survey means nothing to you, then click here.

    Although the process with Clip is somewhat different (two devices, manual points), you systematically identify the same problems:

    Lag Trap #1: Co-Channel Interference (CCI)

    The problem: Your access point and a neighboring AP use the same/adjacent overlapping Wi-Fi channel. They interfere with each other. End devices and APs compete for the available bandwidth in the air.

    How Clip finds it:

    – Interference maps in Hamina Onsite immediately show multiple APs on the same channel

    – SNR (Signal-to-Noise Ratio) breaks down where coverage overlaps

    – You see: “Here are 4 APs on channel 48 (5 GHz) active simultaneously”

    Solution: Optimize channel planning (validated in Hamina Planner with Clip data).


    Lag Trap #2: Roaming Gaps & Poor Transitions

    The problem: Device switches between APs but loses packets in the process or – worse – jumps wildly back and forth (roaming jitter).

    How Clip finds it:

    – You walk the roaming path with smartphone + Clip (e.g., corridor between two APs)

    – Continuous measurement shows the handover point

    – Signal too weak before switching? → Adjust AP placement

    – Overlap too large? → Reduce TX power

    – Clients switched backward? → Channel or band problematic

    Real-world example: “The conference room had a roaming dead spot between AP_Main and AP_Backup. Measured with Clip, adjusted TX power on AP_Main, dead spot gone.”


    Lag Trap #3: TX-Power Errors

    The problem: AP broadcasts too strongly (large overlap, other channels interfere) or too weakly (dead zones).

    How Clip finds it:

    – Coverage heatmap directly shows where signal is too weak

    – Interference maps show areas with too many overlapping APs

    – You go to the problematic AP and note the current power (e.g., “AP_L2_34: 20 dBm”)

    – Clip measurement before and after TX power change immediately shows the impact

    Live correction:

    1. Lower TX power from 20 dBm to 17 dBm

    2. Revalidate with Clip

    3. Heatmap updates in real-time

    4. Better or worse? See immediately.


    Lag Trap #4: Jitter & Performance Drops

    The problem: Connection is stable but jittery – fast packets get lost, gamers experience lag.

    How Clip finds it:

    – Hamina Onsite directly shows SNR and signal stability

    – Areas with weak/fluctuating signal = jitter sources

    – Combined with Hamina Planner capacity analysis/live view shows: Is it a signal problem or overload?

    – Integrated with the Orb app (if available) for active responsiveness tests


    Lag Trap #5: Capacity Bottlenecks

    The problem: Signal is good, but too many clients on one AP/channel
    ->data throughput collapses.

    How Clip finds it:

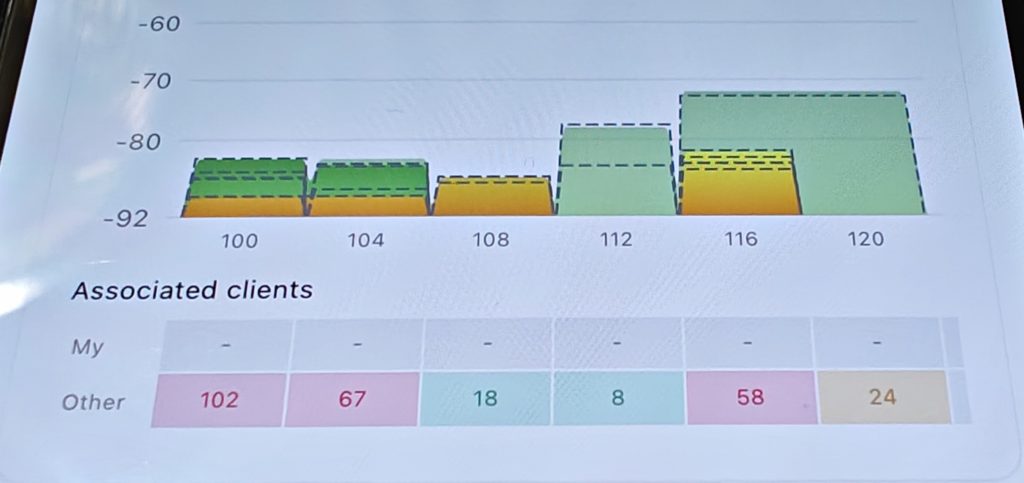
    – Analysis in the Onsite APP shows number of connected clients per channel

    – Heatmap overlay combined with client count: “This zone has good signal but 80 clients on 1 AP – overload!”

    – Solution: Plan and install second AP/radio in this area or optimize band steering in Hamina Planner with live view


    Hamina CLIP Compared to Other Solutions

    Your role determines the tool:

    – Integrator/Freelancer with 3+ projects/month? → Clip (ROI quickly achieved)

    – IT admin who only surveys occasionally? → Deep Survey or hire Wi-Fi Pro with Clip/Nomad (outsource, low-cost, case-by-case)

    – Enterprise Wi-Fi team with real complexity? → Hamina Wireless with Clip & Nomad
    (Industry standard, affordable, easy to use and current – Cloud approval? ISO 27001/SOC 2)
    Alternative: Ekahau Connect with Sidekick 2 – proven, well-known, elaborate, Cloud approval?

    – Auditor? → Nomad & Spectrum Analyzer like the Oscium Lucid (https://oscium.com/products/wi-spy-lucid/) or the NXT-2000 from NetAlly (https://www.netally.com/products/nxt-2000/)

    Alternative 1: SIDOS – agile, new, rental model

    Alternative 2: Ekahau Connect with Sidekick 2 – proven, well-known, expensive


    Clip in Practice: 3 Application Examples

    Example 1: AP-on-a-Stick in New Office (30 min, 1,200 m²)

    Situation: New office buildout, 5 APs planned in Hamina Planner. But: “Does this really fit?”

    Process:

    1. Take Clip + iPhone, load building plan from Hamina

    2. Mount AP at position #1 on tripod (approx. 3 min)

    3. Walk around with Clip, set ~20 measurement points (approx. 15 min)

    4. Heatmap shows: AP #1 alone is not enough for the southern wing

    5. AP at position #2 on tripod, same spot, re-measure (approx. 10 min)

    6. Now perfect – go for installation

    Result: Instead of “build wrong, then regret” you know beforehand that the planning works. Cost savings from errors: €1,000 + X


    Example 2: Post-Installation Validation (2 hours, Retail Store)

    Situation: New Wi-Fi network live, users report: “Wi-Fi is weak up here (2nd floor).”

    Process with Clip:

    1. Go to 2nd floor, start Clip

    2. Continuous survey in warehouse area → heatmap shows: “Dead zone under metal stairs”

    3. Next AP was planned too far away

    4. With Clip data back to office, in Hamina Planner: “If I move AP_2 30cm closer to the corner, the zone is covered”

    5. Technician goes up, moves AP 30cm, Clip validation shows: Problem solved ✓

    Total time: 2 hours (1h measurement, 1h adjustment + validation)

    Without Clip: 3–4 days planning, discussions, multiple try & error cycles.


    Example 3: Troubleshooting – “Wi-Fi drops during meetings”
    (45 min, Consulting Firm)

    Situation: Conference room on 4th floor has had Wi-Fi problems for 2 weeks. Many helpdesk calls, satisfaction declining, online meetings are unclear, audio choppy.

    Process with Clip:

    1. User reports: “Around 2:00 PM it gets bad”

    2. With Clip + iPhone to conference room

    3. Start survey, collect 10 min of data

    4. Live heatmap shows: Interference in U-NII-2A band
    (Neighboring building is very close and uses channel 58)

    5. Hamina simultaneously shows: 3 APs competing here for channel 52

    6. Solution: Switch channel to a different DFS channel, Clip validation

    7. Problem gone

    Root cause analysis: With Clip you can clarify this in 45 minutes. Without Clip it would be speculation, guessing, maybe a week of suffering.


    Clip + Hamina: The Process in Detail

    Workflow for typical Wi-Fi project including AP-on-a-Stick

    1. PLANNING PHASE (in office, in Hamina Planner)

       – Create RF planning

       – Simulate AP positions

       – Predict expected coverage

       ↓

    2. FIELD PREPARATION

       – Charge Clip + iPhone

       – Synchronize building plan to iPhone (offline possible)

       – Prepare AP + tripod

       ↓

    3. SITE SURVEY (on-site)

       – Mount AP on tripod at planned position

       – Start Clip + Hamina Onsite

       – Collect 20–40 measurement points (Point or Line mode)

       – Compare live heatmap with planning

       – If necessary, move AP and re-measure

       ↓

    4. VALIDATION & DOCUMENTATION

       – Take screenshots, photos of problems

       – Notes directly in building plan with Onsite app (“Metal wall here breaks signal by 10 dB”)

       ↓

    5. CLOUD SYNC & ANALYSIS (back in office)

       – Synchronize data to Hamina Cloud

       – Deeper analysis with Planner web UI

       – Generate report

       – Customer handoff

       ↓

    6. INSTALLATION & HANDOVER

       – Physically install AP (confirmed with data from Clip measurement)

       – Optional but RECOMMENDED: Post-installation validation with Clip


    Cost & ROI: When Does Clip Pay Off?

    Investment

    – Clip device: 990 $/€ incl. 6 months Onsite license
    (significantly cheaper than Nomad)

    – Hamina Onsite Subscription: ~ €56 / month

    – iPhone/iPad: (probably already available)

    Total Entry: < €1000

    Scenarios: Break-Even

    Scenario A: Integrator with 10 Projects/Year

    – Old method: €2,000 × 10 = €20,000 /year

    – With Clip: €[Clip] + €780 = < €1000

    – Time & cost savings: around €19,000 in the first year

    – Break-even: Project 1–2

    Scenario B: IT Admin with 2–3 Surveys/Year

    – Probably not ROI-positive (Deep Survey is cheaper)

    – But: If surveys & troubleshooting occur frequently, Clip pays off quickly

    Scenario C: Enterprise Wi-Fi Team with 20+ Locations

    – Clip + Hamina pay for themselves after the first month

    – Continuous validation becomes practical and economical


    Frequently Asked Questions about Clip

    Q: How does Clip differ from a free Wi-Fi analyzer app?

    A: Free apps are software-based (receiver only). Clip is hardware with a professional measurement card and ensures you have reliable, calibrated readings – not just raw data from the iPhone chip.

    Q: Can I use Clip without Hamina?

    A: Theoretically yes (via WiFi Explorer Pi – https://www.intuitibits.com/products/wifiexplorerpi/). But the combination is optimized. Without Hamina Onsite you lose the validation features. With Hamina Planner it becomes a complete solution for the entire process.

    Q: Do I need Wi-Fi expertise to use Clip?

    A: No. The Hamina Onsite app is very beginner-friendly. But: Understanding what the heatmaps mean (SNR, interference, coverage) is important. Clip is a tool, not magic. We offer training for this: Hamina Survey Specialist (https://www.hamina.com/training)

    Q: How accurate are Clip’s measurements vs. Nomad?

    A: Nomad has 4 radios and can scan in parallel. Clip with 2 radios must measure sequentially, therefore needs a bit longer. For 95% of use cases, Clip is sufficient. Since Clip uses very new intelligent scanning methods, the difference is hardly noticeable in many cases. Already tested and proven live in various scenarios multiple times.

    Q: Can I also use Clip outdoors?

    A: Yes. Hamina Onsite also supports outdoor surveys. Clip works anywhere as long as the iPhone has a connection.

    Q: What is Clip’s battery life?

    A: [typically 3–6 hours continuous operation, vs. 4h for Nomad]

    Q: Do I need the building as a 3D model in Hamina?

    A: No. 2D floor plan is completely sufficient. 3D is an optional feature for complex environments.


    The Bigger Picture: Clip as a Tool for Wi-Fi Professionals 2026

    Wi-Fi validation in a passenger train

    Wi-Fi surveys are no longer “big event, once a year, expensive”. They are a continuous optimization tool.

    With Clip this becomes possible:

    – Quick validation before installation commitment

    – Agile adjustment during ongoing operations

    – Preventive troubleshooting instead of reactive “problem-solving”

    – Cost-effective scaling – more locations, similar costs

    Clip is aimed at technicians who know: Good Wi-Fi planning is not one-time – it’s a process.


    Summary: Clip – The Professional Measurement Device for Your Pocket

    Clip is not for everyone – but for almost everyone.

    If your answer to the following questions is yes:

    – ✓ Do you do 3+ Wi-Fi surveys per quarter?

    – ✓ Do you need quick, on-site validation instead of remote reports?

    – ✓ Does your team already work with Hamina Planner?

    – ✓ Is cost efficiency important (small-to-medium business)?

    – ✓ Do you want live troubleshooting, not just planning?

    Then Clip is the right choice.

    The device is:

    – Small & light: Fits in jacket pocket

    – Intelligent: Measures almost all lag traps automatically

    – Economical: 5–10× cheaper than traditional enterprise devices

    – Practical: Two devices, wireless, simple workflow, reliable results

    – Hamina-native: Integrated with Planner & Onsite Cloud

    With Clip + Hamina you have a complete Wi-Fi assessment and optimization portfolio – scalable from remote overview assessment to detailed field troubleshooting.

    → Time to modernize Wi-Fi surveys.


    Next Steps

    1. Book free demo: Test Clip + Hamina Onsite

    2. Technical data sheet: hamina.com/clip Clip specs & compatibility


    Bonus TIP for Hamina Wireless Users:

    The Network Status Heatmap – Everything at a Glance

    Wi-Fi Network Status using Frankfurt Main Station as an example – figure centered in plan

    With the latest version (20.01.2026) of Hamina Network Planner, there is now the Network Status Heatmap for everyone!
    This functions as a “summary” (roll-up) of all other heatmaps – you see at a glance whether your network meets all requirements or not. The color coding immediately shows you how many heatmaps fail to meet your specifications.

    What does “meeting requirements” mean?

    In Hamina Network Planner you define a threshold value (highest acceptable value) for each heatmap.
    Example Coverage: If you’ve set “-65 dBm”, coverage is considered met if it’s -65 dBm or better (i.e., e.g., -60 dBm = green, -70 dBm = red).

    Typical standard threshold values (adjustable):

    • Primary Coverage: Green ≥ -65 dBm, Yellow -70 dBm, Red < -75 dBm
      in the example above -67 dBm
    • Secondary Coverage: Green ≥ -67 dBm, Yellow -70 dBm, Red < -75 dBm
      in the example above -68 dBm
    • SNR: Green ≥ 25 dB, Yellow 20 dB, Red < 15 dB
      in the example above met and therefore hidden
    • Interference: Green <2 APs, Yellow 3 APs, Red 4 APs
      in the example above 4 APs
    • Channel Utilization: Green 0-30%, Yellow 30-49%, Red >49%
      in the example above 50%

    Enable/Disable Network Status

    Want to include certain heatmaps (e.g., only Coverage + SNR) in the summary?

    1. Expand Legend menu (popover)
    2. Select “Global Settings”
    3. Activate/deactivate toggle switches at the bottom for each heatmap

    Mouseover Inspector: Which requirement fails exactly?

    Just like all other heatmaps, Network Status has a mouseover inspector: Hover over a spot and you see exactly which requirements are failing:

    • “Coverage: -72 dBm (below -65 dBm) ❌”
    • “SNR: 18 dB (below 25 dB) ❌”
    • “Interference: 3 APs on channel 48 ❌”

    Perfect for quick analysis: When Network Status is red, you immediately see what the cause is – and can optimize specifically.

    #HaminaCLIP #HaminaWireless